식이와 비만
Diet and Obesity
Article information
Trans Abstract
Obesity can be defined as a state of excess body fat or body energy stores in excess of physiological needs. The prevalence of obesity has increased dramatically throughout the world. Despite the greater understanding of the physiologic mechanisms regulating body weight and energy balance, the causes of human obesity poorly understood. Much of human obesity is multifactorial and usually involves relative over-consumption of food. And, consumption of high-fat diets is implicated in the etiology of obesity. Fat-derived energy intake has increased in Korea. Changes in gastric motor and sensory functions can be associated with development of obesity. A High-fat diet may facilitate adaptive changes that contribute to the development of obesity through reduced postprandial satiation in persons with a high baseline maximum tolerated volume. A high fat intake may influences the central control of appetite and behavioral choices in food intake. Further well-controlled large studies with a longer preload duration in Koreans to elucidate the presence and extent of gastrointestinal sensory, motor, absorptive, and behavioral adaptations to diets enriched with specific macronutrients. (Korean J Med 2012;82:291-297)
서 론
비만은 체내 지방의 과다 축적이나 체내에 에너지가 생리적인 필요량보다 과하게 축적되어 있을 때로 정의된다. 비만은 최근 20-30년내에 전 세계적으로 유병률이 증가하고 있으며[1] 우리나라에서도 비록 유병률은 낮지만 서서히 증가하고 있는 것 같다[2]. 2009년 국민건강영양조사(Korean National Statistical Office)에 의하면 체질량지수(body mass index, BMI)가 25보다 큰 경우가 우리나라 만 19세 이상 인구 중 31.9%였다[3]. 비만은 뇌혈관 질환, 심장 질환, 당뇨병, 고혈압성 질환뿐만 아니라 소화기암을 비롯한 악성 종양의 발생과도 관련이 있으며 또한 사망률도 높인다[4-7].
비만의 발생 기전에 대해서 아직 잘 모르지만 비만은 유전적 요인, 환경적 요인과 정신적 요인 등이 복합적으로 작용하여 발생할 것이다. 이 중에서 유전적 요인이 아주 중요한 인자인 것은 분명하나 지난 20여 년간 비만이 전 세계적으로 급격하게 증가하고 있다는 역학적 사실은 식이 섭취량의 증가와 운동량의 부족 등의 환경적 요인이 주로 작용하고 있다는 것을 반영한다. 아마 대부분의 비만은 인체 요구량 이상으로 음식을 과다하게 섭취하여 발생할 것이다. 비만은 음식의 과다한 섭취와 더불어 고지방식의 섭취에 의해서 유발될 수 있다[8,9]. 즉, 우리가 먹는 음식의 영양소 구성에 따라서 비만이 발생할 수 있는데 고지방식이 어떤 기전으로 비만을 초래하는지 아직 확실하지 않다. 본고에서는 비만의 발생과 영양소의 구성비가 어떤 연관성이 있는지를 위의 기능 변화를 중심으로 기존의 연구결과들을 근거로 살펴보고자 한다.
영양의 변화와 비만
지난 수십 년 동안 식이와 생활환경 등이 변하여 전 세계적으로 비만의 발생이 증가하고 있다. 즉, 여러 가공식품의 개발로 단 음식, 음료수, 고지방식 등의 섭취 증가와 각종 편의 시설이 발달하여 운동량의 감소 등으로 인하여 비만의 유병률이 증가하고 있다[10-19]. 우리나라를 비롯한 아시아 국가들은 서구와 달리 비교적 짧은 시기에 경제적 발전을 이루어 식이가 급격하게 변하고 있다. 2000년도 보고에서 이미 우리나라 사람의 지방섭취(fat-derived energy intake)는 6.2%에서 18.8%로 증가하고 있다[20].
비만과 위 기능
특정 영양소의 섭취가 위기능에 어떤 영향을 초래하는 가에 대하여 논하기 전에 비만 환자의 위기능에 어떤 변화가 있는지 알아봄으로써 식이와 위기능을 이해하는데 도움을 받을 수 있다. 음식의 섭취와 소화에 관한 정보는 소화관과 간에서 중추신경계로 전달되는데 이러한 감각 정보가 음식의 섭취 정도와 체내에너지 항상성 유지에 중요한 역할을 한다[21,22]. 소화관 중에서도 위의 운동과 감각 기능의 변화는 배고픔과 포만감의 발생과 밀접한 연관이 있다. 위의 감각 기능은 음식 섭취를 중단하는데 있어서 매우 중요한 역할을 할 것이다. 이러한 위의 감각 반응은 위의 긴장도(tone), 순응도(compliance)와 위 배출속도에 의해서 어느 정도 영향을 받는다[23].
비만 환자에서 위의 운동과 감각 기능의 변화가 보고되어 왔으며 이러한 변화가 비만에 의해서 이차적으로 야기된 것인지 혹은 위의 기능 변화가 비만을 유발시키고 유지시키고 있는지는 확실치 않다.
비만과 위 배출능
위의 배출은 자율신경계와 호르몬 등의 다양한 인자에 생리적으로 엄격하게 조절되고 있다[24,25]. 이러한 자율적 조절은 장관이 지나치게 고삼투 용액으로 채워지거나 소화 능력을 넘어서는 과량의 영양분이 소장내로 이동하는 것을 방지하며, 체 순환 등에 적합하도록 영양분의 위 배출 속도를 조절하고 있다. 또한 위내에 미즙(chyme)이 오랫동안 남아 있도록 함으로써 포만감을 유지시켜 음식 섭취의 빈도를 줄인다.
인체의 비만도와 위 배출 시간을 비교한 여러 연구의 결과들은 다양하여 비만 환자에서 정상 체중군보다 위 배출속도가 증가[26-28], 감소[29-32] 혹은 유의한 차이가 없었다[33-36]. 이러한 차이는 연구 대상자가 달랐거나, 시험 식이의 다양성[36], 측정 방법의 차이 등에 기인할 수 있다. 또한 여러 가지 인자들이 위 배출 속도에 영향을 미칠 수 있다. 연구 대상자의 체중 변동 정도, 이전의 식이력, 여성의 경우 생리 주기에 따른 호르몬 농도와 흡연력 등의 차이가 각 연구 결과의 차이를 어느 정도 설명해 줄 수 있다[23]. 비만 환자에서 위 배출 속도가 증가 혹은 감소 되었는가에 대한 결론을 얻기 위해서는 대규모의 다기관 연구가 필요하다. 대체적으로 비만 환자에서 유동식의 위 배출은 정상인과 차이를 보이지 않으나 고형식의 위 배출은 비만 환자에서 유의하게 빠르다. 이와 같이 빠른 위 배출은 포만감을 느끼는 기간을 줄이며 다음 음식을 먹기까지의 시간을 단축시킴으로써 비만의 원인이 될 수 있다. 만약 체중이 감소된 후에도 고형식에 대한 위 배출이 항진되어 있다면 다시 비만을 유발할 수 있을 것이다.
이전의 연구들에 의하면 위 배출능의 이상이 비만을 유발한 것인지 혹은 비만이 위 배출능의 이상을 초래한 것인지는 결론을 내리기가 힘들다. 또한 위의 기능 중에 음식의 섭취에 관여하는 다른 인자들이 있을 수 있다. 이러한 인자로서 위의 용적과 적응 등을 들 수 있다.
비만과 위의 용적
음식을 섭취할 때 위가 팽창되면 팽만감이나 포만감이 유발된다. 그 기전은 명확하지 않으나 음식 섭취에 의해서 위가 팽창되면 위의 신장 수용기(stretch receptors)를 자극하여 미주 신경 방전을 유발하며 이는 시상하부 신경세포(hypothalamic neuron)를 활성화하여 포만감을 유발하는 것으로 보인다[37]. 한 연구에 의하면 정상 체중 건강인의 위를 800-900 mL 정도 팽창시켰을 때 상복부 팽만감, 복통, 오심과 구역질 등이 유발되었다[38]. 비만이 지나친 칼로리 섭취에서 발생한다는 면에서 볼 때 위 용적이 큰 경우 매번 먹을 수 있는 음식의 양이 많으므로 비만을 유발할 수 있을 것이다. 또한 음식을 섭취하면서 발생하는 위의 팽창은 팽만감이나 포만감을 일으키는데 위의 용적이 큰 경우 상대적으로 팽만감이나 포만감은 잘 발생하지 않을 것이다.
비만 환자를 부검하여 연구한 바에 따르면 간, 소장, 췌장 등의 복강내 장기들이 정상 체중을 가진 사람들에 비해 무거웠다[39]. 한편, 다른 연구에서는 위의 크기가 매우 다양하여 체중과 관계가 없었다[40]. 즉 비만 환자들은 위의 용적과 무관하게 식욕이 과도하게 증가되어 있을 수 있다. 반면 다른 연구들에서는 비만 환자의 위 용적이 정상 체중군보다 유의하게 더 크다고 보고되었다. 비만군과 정상 체중군 간에 위의 용적을 비교한 연구는 측정 방법에 따라서 크게 두 가지로 나눌 수 있다. 위 속에 풍선을 삽관하여 측정하는 방법과 보다 생리적인 방법인 영상법이 있다.
위 속에 라텍스 풍선(latex balloons)을 넣고 물로 채워서 위의 용적을 조사한 연구에서 최대로 참을 수 있는 물의 양을 위의 용적으로 보았을 때 16명의 비만군에서 11명의 정상 체중군보다 위의 용적이 더 컸다(1,763 ± 70 vs. 1,000 ± 67 mL) [41]. 다른 연구에서는 정상 여성, 비만 여성, 신경성 거식증 여성에서 분당 100 mL 속도로 위 속의 풍선으로 물을 채워 넣었을 때 최대 인내치로 나타낸 위의 용적은 거식증, 비만, 정상 여성의 순으로 컸다[42]. 따라서 위의 용적은 체중보다는 폭식 행동에 더 영향을 받았다. 또한 체중이 감소되고 난 이후에 위의 용적이 변하는지 알아 보았을 때 4주간 식이 요법으로 체중이 평균 9.1 kg 감소되었던 비만군에서 위의 용적이 현저히 감소하였다[43]. 이는 위 용적의 증가는 비만의 원인이라기보다는 비만에 의해서 2차적으로 생기는 결과라고 볼 수 있다.
한편, Klatt 등[44]은 31명의 비만인과 20명의 건강 자원자를 대상으로 폴리에틸렌 풍선(polyethylene balloon)을 이용하여 물 대신 공기를 넣는 바로스타트 연구를 발표하였다. 비만군의 기저위 긴장도(basal gastric tone), 식후 위 적응(accommodation), 팽창에 대한 지각반응(perception) 등은 정상인과 차이를 보이지 않았다. 이와 같이 바로스타트 연구 결과가 물을 채운 라텍스 풍선의 결과와 다른 이유는 라텍스의 경우 위 전체를 채운 반면 폴리에틸렌 풍선은 위저부만 채운 차이가 있다. 또한 라텍스는 자체의 내부 순응도(intrinsic compliance)를 가지는 반면에 폴리에틸렌은 그렇지 않다는 차이 등이 있다. 그렇지만 두 방법 모두 도관을 위 속에 넣는데 따른 반사이완 등을 배제하지 못하는 문제점이 있다. 즉 비만 환자에서 위내 삽관이나 풍선 팽창에 따른 반사 이완이 더 현저하게 나타날 가능성을 배제할 수 없다는 의문이 있으며, 앞서 소개한 체중 감소 전후의 위 용적 비교 연구 또한 복압의 역치에 도달하는데 필요한 양이 복벽의 두께 차이에 따라 영향을 받으므로 문제가 된다.
그러므로 이러한 연구에서는 보다 생리적인 비침습적인 방법이 필요하다. 초음파를 이용한 소아를 대상으로 한 연구에서 공복 시 위전정부 면적이 넓을수록 BMI가 증가하였다[45]. 단일광자방출단층촬영술(99mTc-SPECT)를 이용해서 위용적을 측정해 보았을 때 13명의 중등도 비만 환자군과 19명의 정상 체중군에서 공복 시와 식후의 전체 위 용적에는 차이를 보이지 않았으나 공복 시 원위부 위용적이 비만 환자에서 더 컸다[46]. 원위부 위용적이 큰 경우에 팽만감이나 포만감을 유발하기 위해서는 많은 양의 음식 섭취가 필요할 것이다. 아마도 이것이 비만의 발생과 연관이 있을 것으로 추정된다.
Mayo Clinic의 Delgado-Aros 등[47]은 134명의 자원자를 대상으로 포만감에 대한 위 용적과 신체 비만지수 각각의 영향을 조사하였다. BMI가 증가할수록 공복 시 위 용적이 증가하지 않았다. 반면에, BMI가 증가할수록 식후 위용적이 감소하는 경향을 보였는데 이것의 임상적 의의는 아직 잘 모른다. 한편 BMI가 증가할수록 포만감이 늦게 발생하였고, 과체중이나 비만 환자가 정상 체중인에 비해 최대 포만감에 이르기 위해 평균 225 ± 57 kcal를 더 섭취했다. 공복 시 위 용적이 클수록 포만감이 늦게 발생하였는데 이 효과는 BMI와 무관하였다. 신체비만지수와 공복 시 위 용적이 클수록 포만감이 늦게 발생하였다. 이와 같은 결과는 공복 시 위 용적을 변화시키는 기전이 포만감에 영향을 줄 것을 시사한다(Fig. 1).
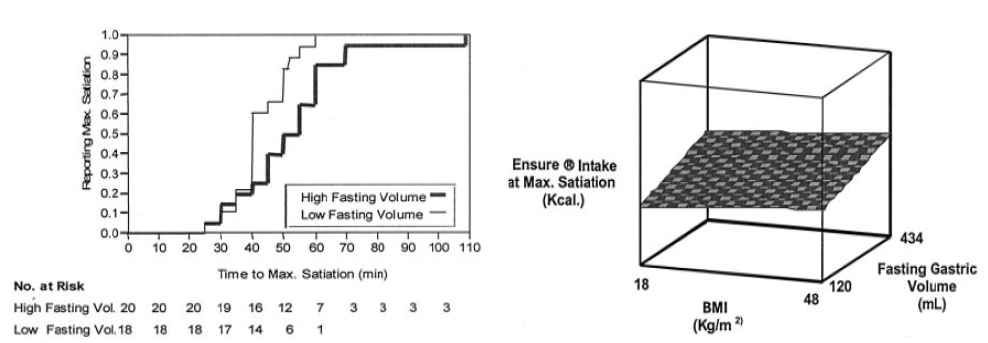
(A) Effect of fasting gastric volume on time to satiation. Kaplan-Meier curves with the proportion of participants who reported maximum satiation while drinking at a constant rate, grouped by fasting gastric volume (below and above the median [211 mL] of the sample). Note that those with a lower fasting volume presented maximum satiation sooner (median time, 40 minutes) than those with a higher fasting gastric volume (median time, 55 minutes); p = 0.007 by the log-rank test. (B) Effects of BMI and fasting gastric volume on caloric intake to achieve satiation. This bidimensional plot depicts the independent effects of BMI and fasting gastric volume on caloric intake to reach maximum satiation. Note that caloric intake increases with a different slope with BMI and with fasting gastric volume (from ref. 47 with permission).
식이와 위 기능
고지방식은 비만의 발생과 연관되어 있다. 고지방식을 장기간 섭취하면 아마도 위장관이 생리적으로 적응하게 되어 체중이 증가할 가능성이 있다. 특정 영양소의 섭취는 위장관의 구조와 기능에 변화를 초래한다[48-62]. 쥐를 이용한 동물실험에서 고지방식을 1주에서 8주 정도 먹이면 소장 융모의 높이가 커지고 췌장 지방분해효소(pancreatic lipase)의 분비가 증가되었다[56-58]. 또한, 고지방식 후 지방을 십이지장내로 주입하면 위 배출능의 저하와 식이 섭취의 저하의 정도가 감소되었다[50-52]. 동물실험의 결과를 종합해 보면 일정 기간 고지방식을 섭취하게 되면 생리적인 적응이 생겨 영양소의 흡수능이 증가하고 음식의 섭취도 증가할 수 있다는 것을 보여준다. 사람을 대상으로 한 연구 결과는 일정하지 않아서 아직 결론을 내리기는 이르다. 식이와 위기능에 대한 몇몇 연구들을 살펴 보겠다.
식이와 위 배출능
1991년 Cunningham 등[53]은 12명의 건강자원자에서 2주간 고지방식과 저지방식을 먹인 뒤 비교하여 보았을 때 고지방식군에서 저지방식군에 비하여 고지방시험식이에 대한 위배출시간과 구강맹장 통과시간이 단축되었다고 하였다. 또한 동일 연구자들은 26명의 건강자원자에서 표준식이와 포도당이 첨가된 식이를 2주간 먹인 뒤에 위 배출능을 비교하였을 때 포도당에 대한 배출능은 포도당 첨가 식이군이 표준식이군에 비하여 더 항진되었으나 단백질에 대한 위 배출능은 양 군 간 유의한 차이는 없었다[54]. 다른 연구에서도 2주간의 고지방식이 후 고지방시험식이에 대해서만 위 배출능만 항진되었다[60]. 따라서 사람에서 2주간의 시험식이에 대한 위의 적응(Adaptation)은 영양소에 특이한 반응처럼 보였다. 특이 영양소 섭취에 따른 위 배출능의 항진은 포만감을 감소시킬 수 있어서 음식 섭취의 증가로 이어져 비만을 유발할 수 있다. 그렇지만 이전의 연구들은 피험자 수가 적고, 연구 설계가 제한적이라는 단점이 있다. 이런 제한점을 극복하기 위해서 최근에 Mayo Clinic에서 이루어 진 연구에서는 고지방식이군, 고탄수화물식이군, 고단백질식이군, 표준식이군으로 나누어서 2주간 먹인 다음 표준시험식이에 대한 위 배출능을 조사해 본 결과 네 군 간에 유의한 차이는 없었다. 아마도 각 식이에 대한 위의 적응이 일어나기에는 2주간의 시험식이 섭취기간이 충분하지 않았을 가능성이 있다[63].
식이와 위 감각능
위감각능은 영양죽 마시기 검사(nutrient drink test) 시 측정하는 최대인내양(maximum tolerated volume, MTV)으로 간접적으로 알 수 있다[47,65]. 특정 식이에 따른 최대인내양은 네 군 간에 유의한 차이가 없었다(Fig. 2). 그렇지만 기저 최대인내양이 많았던 피험자만을 대상으로 한 비교에서는 고지방식이군이 다른 세 군에 비하여 최대인내양이 유의하게 더 많았는데 BMI와는 연관성이 없었다. 이전의 연구에서 BMI와 단일광자방출단층촬영술(99mTc-SPECT)를 이용해서 측정한 위용적은 각각 MTV의 독립된 예견인자이고[65] 기능성 소화불량증군과 비만군에 있어서 포만시 식후 증상은 공복시 위용적과 유의한 상관관계를 가진다[65,66]. 공복 시 위용적은 네 식이군 간에 유의한 차이는 없었다[63]. 이러한 연구결과들에서 유추해 보면 만약 건강한 성인이 고지방식을 지속적으로 먹게 되면 위 적응에 의하여 식후 포만에 이르는 시간이 지연되고 만족스러운 포만감에 이르기 위해서는 보다 많이 먹게 되어 결국 비만이 발생할 수 있다.
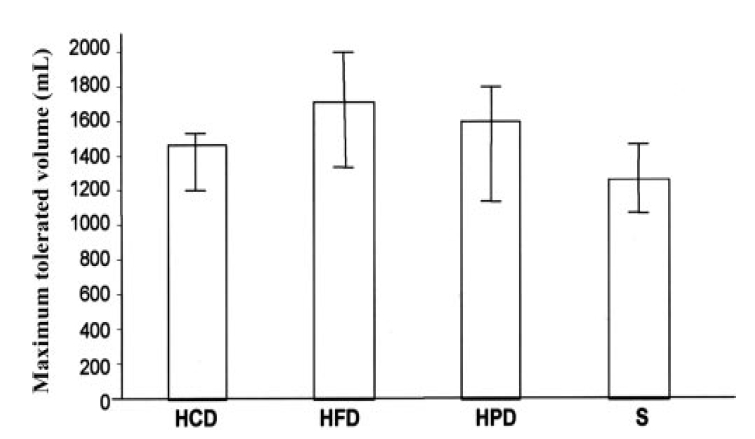
Comparison of the effects of 3 different macronutrient preloads (high-carbohydrate diet [HCD], high-fat diet [HFD], and high-protein diet [HPD]) with those of a standard diet (S) on maximum tolerated volume in subjects with a high baseline maximum tolerated volume (50% of the baseline value). N = 13 per group. Medians and interquartile ranges are shown. No significant differences were observed across groups (ANCOVA). An interaction between treatment group and baseline maximum tolerated volume was detected (p < 0.01); an effect of fat was detected in subjects with high baseline MTV values (p < 0.05) (from ref. 63 with permission). ANCOVA, Analysis of covariance.
식이와 식욕
12명의 건강자원자에서 2주간의 고지방식이를 섭취한 후 측정한 공복감은 교차연구에서 저지방식이를 섭취한 후와 비교하였을 때 유의한 차이는 없었다[53]. 다른 교차연구에서 2주간 고지방식이와 저지방식이를 섭취한 후 뷔페식을 먹게 하여 섭취양과 영양소의 구성비를 비교하여 본 결과 양군간에 유의한 차이는 없었다[62]. 최근의 연구에서도 2주간의 시험식이 섭취 후 측정한 뷔페식 검사에서 네 군 간에 섭취양, 영양소의 구성 등은 유의한 차이가 없었다[63]. 이는 아마도 시험식이 섭취기간이 2주로 비교적 짧아 생리적 적응이 일어나지 않았을 가능성이 있다.
결 론
지난 수십 년 동안 식이와 생활 환경 등이 변하여 전 세계적으로 비만의 발생이 증가하고 있다. 최근 우리나라 사람들에서도 비만의 유병률은 증가하고 있으며 지방섭취의 증가도 여러 요인 중의 하나일 수 있다. 비만의 발생은 위 배출능과 위 용적 등의 변화에 기인할 수 있다. 반복적인 고지방식은 위의 기능에 적응성 변화를 초래하여 음식 섭취를 증가시켜 비만을 유발할 수 있다. 향후 특이 영양소 섭취 후 발생하는 위장관의 적응성 변화에 대한 체계적이고 대규모의 연구가 시행되어 비만의 발생 원인을 규명하는 계기가 마련되기를 기대한다.