Statin 치료시 LDL 콜레스테롤의 직접 측정값과 계산값의 비교
LDL cholesterols levels after statin treatment: A comparison of measured vs. estimated values
Article information
Abstract
목적:
LDL 콜레스테롤의 수치를 적정 수준으로 조절하는 것이 고지혈증에 의한 심혈관계 질환의 1차적 혹은 2차적 예방에 매우 효과적이다. Statin의 사용은 일차적으로 LDL 콜레스테롤의 감소를 목표로 하지만, Friedewald 공식에 이용되는 세 가지 변수인 총 콜레스테롤, 중성지방과 HDL 콜레스테롤의 변화도 관찰된다. 이제까지 직접측정법과 Friedewald 공식에 의한 계산법을 비교한 연구들에서는 statin 치료를 고려해서 분석하지 않았으므로 기존의 연구 결과가 statin을 사용한 후에도 적용될 수 있을지는 아직 알 수 없다. 이에 우리는 statin 치료 후에 Friedewald 공식에 따른 계산값을 직접 측정법으로 측정한 LDL 콜레스테롤 결과와 비교하여 그 차이를 분석하고자 하였다.
방법:
메리놀병원 내분비내과와 심장내과 진료를 받고 있는 환자들 중에서 적어도 6개월 이상 statin을 복용한 985명의 심혈관 질환 고위험군인 환자들을 대상으로 연구하였다. 총 콜레스테롤, 중성지방, HDL 콜레스테롤 측정치를 이용한 Friedewald 공식으로 계산된 LDL 콜레스테롤 수치를 직접 측정한 LDL 콜레스테롤 수치와 비교하였다.
결과:
Statin 치료 후 DLDL-C은 80.5±21.3 mg/dL이었고, FLDL-C은 82.1±23.3 mg/dL이었다. 두 수치를 비교하였을 때, 전반적인 상관관계는 양호하였으나(R2=0.879) paired t-test 상에서 두 값의 차이는 통계적으로 유의하였고, 실제 42% 이상의 환자에서 %ΔLDL이 ±10% 이상이었다. 계산값과 직접 측정값을 당뇨병 환자의 LDL 콜레스테롤의 치료 목표인 100 mg/dL을 기준으로 목표 도달률을 비교하였을 때, 비당뇨병군에서는 통계학적으로 유의한 차이가 없었지만(p=0.132), 당뇨병군에서는 통계학적으로 유의한 차이가 있었다(p=0.007).
결론:
Statin 치료 후 Friedewald 공식으로 계산한 LDL 콜레스테롤과 직접 측정한 LDL 콜레스테롤 수치는 비교적 좋은 연관성을 보였으나, 각각의 수치의 비교에서는 의미 있는 차이를 보였다. 특히 당뇨병군의 치료효과 판정에서는 유의한 차이가 있었다. 향후 statin 치료의 적정성을 평가하거나 치료 변경 여부를 결정하는 경우에 Friedewald 공식에 의한 계산값과 LDL 콜레스테롤의 직접측정법의 비교에 대해서 추가적인 연구가 뒷받침되어야 할 것으로 생각된다.
Trans Abstract
Background/Aims:
Lowering low-density lipoprotein cholesterol (LDL-C) is the primary target for the prevention of cardiovasculardisease. Previous studies have shown that estimated LDL-C levels calculated using Friedewald’s formula (FLDL-C)are closely correlated with directly measured LDL-C levels (DLDL-C). However, because statins not only reduce LDL-C, but alsoalter the levels of parameters used to calculate FLDL-C (i.e., total cholesterol, triglycerides, and high-density lipoprotein cholesterol),whether calculated LDL-C levels remain a reliable estimate of actual levels after statin treatment is unclear.
Methods:
Subjects included 985 patients at high risk of cardiovascular disease who had taken statins for more than 6 months.FLDL-C data were compared to DLDL-C data.
Results:
A strong correlation was observed between DLDL-C and FLDL-C data (R2=0.879). However, the absolute values forFLDL-C and DLDL-C differed significantly according to a paired t-test, and 42.3% of patients showed a difference of greater than10% between these two values. Among patients with diabetes, the percentage of patients deemed to have achieved target LDL-Clevels differed significantly according to the method of LDL-C determination (p=0.007).
Conclusions:
FLDL-C and DLDL-C data remained well correlated after statin treatment, although the absolute values differedsignificantly according to the LDL-C determination method. Furthermore, the percentage of subjects deemed to achieve targetLDL-C levels differed significantly according to the method of determination among patients with diabetes. (Korean J Med79:277-284, 2010)
서 론
심혈관 질환은 전세계적으로 중요한 사망원인으로 대두되고 있다1). 심혈관 질환의 위험인자로는 흡연, 고혈압, 가족력, 나이와 이상지질혈증 등이 알려져 있다2-4). The National Cholesterol Education Program Adult Treatment Panel III (NCEP ATP III)은 관상동맥 질환의 예방을 위해 이상지질혈증의 조절을 강조하고 있으며, 특히 LDL 콜레스테롤(low density lipoprotein cholesterol)을 일차치료목표로 설정하고 주요 위험인자의 수와 Framingham point score를 이용한 위험도 계산을 바탕으로 위험군을 분류하여 각각에 대한 LDL 콜레스테롤의 치료목표를 제시하고 있다. 이러한 목표를 달성하기 위해서 ATP III에서는 모든 성인에서 최소한 5년마다 일차적 선별 검사로서 총 콜레스테롤, HDL 콜레스테롤(high density lipoproteincholesterol), 중성지방, LDL 콜레스테롤(low density lipoprotein cholesterol)을 포함한 네 가지 항목을 공복 상태에서 측정할 것을 권고하고 있다4). 또한 당뇨병을 포함한 허혈성 심장질환의 고위험군에서는 LDL 콜레스테롤의 정확한 수치를 아는 것이 치료를 결정하는데 매우 중요하다.
LDL 콜레스테롤의 측정의 참고방법으로는 베타 정량법(β-quantification)이 있으나, 이 방법은 검사가 복잡하고 시간이 많이 걸리며, 비싼 기구들과 숙련된 검사인원이 필요하기 때문에 일상적인 검사로 사용하기에는 부적합하다5-7). 현재 LDL 콜레스테롤 측정을 위해 직접측정법인 균질법(homogenous assay)과 Freidewald 공식에 의한 계산법이 가장 널리 쓰이고 있다. 이 두 가지 방법으로 측정한 LDL 콜레스테롤 수치는 일치하지는 않지만 좋은 상관관계를 보인다는 연구들이 발표되어 왔었지만5,8), 중성지방 농도가 아주 높거나 여러 가지 병적인 상태에서는 Freidewald 공식을 사용할 수 없다는 것은 이미 잘 알려져 있다5-13).
Statin (3-hydroxy-3-methylglutaryl coenzyme A reductase inhibitors)의 사용은 일차적으로 LDL 콜레스테롤의 감소를 목표로 하지만, Friedewald 공식에 이용되는 세 가지 변수인 총 콜레스테롤, 중성지방, HDL 콜레스테롤의 감소 또는 증가도 역시 관찰되며 그 변화 폭들은 각각 다양하다14). 이제까지 직접측정법과 Friedewald 공식에 의한 계산법을 비교한 연구들에서는 statin 치료를 고려해서 분석하지 않았으므로 기존의 연구 결과가 statin을 사용한 후에도 적용될 수 있을지는 아직 알 수 없다. 이에 우리는 statin 치료 후에 Friedewald 공식에 따른 계산값을 직접측정법으로 측정한 LDL 콜레스테롤 결과와 비교하여 그 차이를 분석하고자 하였다.
대상 및 방법
1. 대상
2004년 5월에서 2008년 12월까지 메리놀병원 내분비내과와 심장내과 진료를 받고 있는 환자들 중에서 적어도 6개월 이상 statin을 복용한 985명의 환자들을 대상으로 연구하였다. 대상자들 중 569명은 당뇨병 환자였고, 416명은 당뇨는 없으나 10년 Framingham risk가 20% 이상인 고위험 환자였다.
2. 방법
대상자들은 8시간 이상 금식 후 채혈하였고, 총 콜레스테롤, 중성지방, HDL 콜레스테롤, LDL 콜레스테롤을 측정하였다. 총 콜레스테롤은 아산시약(Asan Inc., Hwaseong, Korea)을 사용하여 효소법으로, 중성지방, LDL 콜레스테롤, HDL 콜레스테롤은 DAIICHI 시약(Tokyo, Japan)을 사용하여 효소법으로 측정하였다. 측정 장비는 Hitachi 7600-110 (Hitachi hith-technologies Co., Tokyo, Japan) 자동화학분석기를 사용하였다. FLDL-C은 Friedewald 공식[FLDL-C=총 콜레스테롤-(HDL 콜레스테롤+중성지방/5)]을 이용하여 계산하였으며, LDL 콜레스테롤의 직접 측정치인 DLDL-C과 비교하였다. %ΔLDL은 아래의 공식을 이용하여 계산하였다.
%ΔLDL=[(FLDL-C-DLDL-C)/DLDL-C]×100
(FLDL-C: Friedwald 공식에 의해 계산된 LDL 콜레스테롤 수치, DLCL-C: 직접 측정법으로 측정된 LDL 콜레스테롤 수치)
3. 통계 분석
모든 결과치는 평균±표준편차로 표시하였고, 통계 분석은 SPSS 프로그램(version 12.0)을 이용하였다. 모든 통계학적인 결과는 p 값이 0.05 미만인 경우를 유의성이 있다고 평가하였다.
결 과
대상 환자들의 기본적인 특징은 남성이 416명, 여성이 569명이었고, 569명(57.8%)이 당뇨병을 진단받고 치료 중이었다. 평균 연령은 59.21±10.8세(17~85세), 평균 혈중 크레아티닌 수치는 0.89±0.20 mg/dL (0.5~1.5 mg/dL)였다. 대상자들 중 411명(41.7%)은 atorvastatin, 236명(24.0%)는 rosuvastatin을 복용하였으며, 나머지는 fluvastatin, simvastatin, pitavastatin을 복용하였다(표 1). Statin 치료 전과 후의 총 콜레스테롤은 각각 221.7±35.6 mg/dL, 154.5±26.4 mg/dL으로 29.2±13.4%의 감소를 보였고, LDL 콜레스테롤은 40.2±16.7%의 감소, HDL 콜레스테롤은 2.5±23.7%의 증가, 중성지방은 6.4±55.4%의 감소를 보였다(표 2).
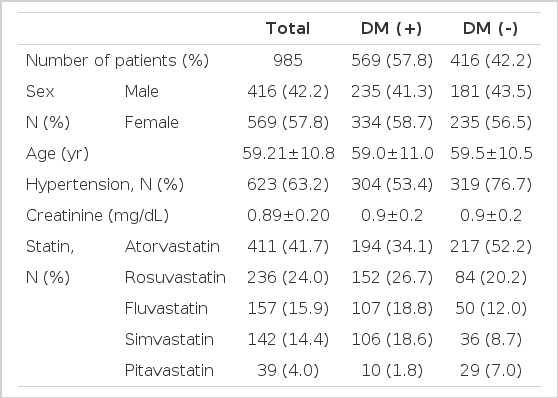
Baseline characteristics of the subjects
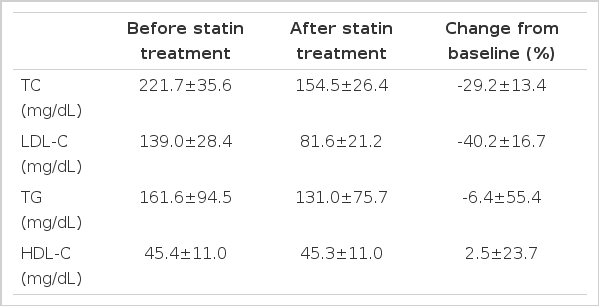
Lipid levels before and after statin treatment
Statin 치료 후 평균 DLDL-C은 80.5±21.3 mg/dL이었고, 평균 FLDL-C은 82.1±23.3 mg/dL이었다. 두 수치를 비교하였을 때, 전반적인 상관관계는 양호하였으며(R2=0.879, p=0.000) 당뇨병군(R2=0.880, p=0.000)과 비당뇨병군(R2=0.876, p=0.000)에서 차이는 보이지 않았다(그림 1). 그러나 DLDL-C과 FLDL-C을 대응표본 T 검정으로 비교하였을 때 당뇨군과 비당뇨군 모두에서 통계학적으로 유의한 차이가 있었다(표 3).
Correlation between directly measured low-density lipoprotein cholesterol (LDL-C) levels and estimated values calculated from Friedewald’s formula after statin treatment.

Comparison of directly measured low-density lipoprotein cholesterol (LDL-C) levels and those calculated using Friedewald’s formula after statin treatment
%ΔLDL의 평균값은 전체 대상자에서 2.9±15.4%, 당뇨병군에서 2.5±15.6%, 비당뇨병군에서 3.4±15.1%이며, 분포는 그림 2와 같다. %ΔLDL가 ±5% 이상 차이가 나는 경우는 전체 대상자에서 68.4%, 당뇨병군에서 69.3%, 비당뇨병군에서 67.3%였으며 ±10% 이상 차이가 나는 경우는 각각 42.3%, 42.3%, 42.6%였다. FLDL-C의 값이 DLDL-C의 값보다 낮게 측정된 경우는 전체 대상자에서 37.4%, 당뇨병군에서 38.8%, 비당뇨병군에서 35.3%였다.

Distribution of the percent differences of those achieving target low-density lipoprotein cholesterol (LDL-C) levels according to the LDL-C determination method.
Friedwald 계산값과 직접측정값을 고위험군 환자의 LDL 콜레스테롤의 치료 목표인 100 mg/dL을 기준으로 나누어 비교하였을 때, 비당뇨병군에서는 통계학적으로 유의한 차이가 없었지만(p=0.132) 당뇨병군에서는 통계학적으로 유의한 차이가 있었다(p=0.007). 당뇨병군에서 statin 치료 후에도 DLDL-C이 100 mg/dL 이상으로 실제로 치료목표에 도달하지 못한 94명의 환자들 중 17.9%인 15명이 FLDL-C은 100 mg/dL 이하로 치료목표에 도달한 것으로 나타났다(표 4).
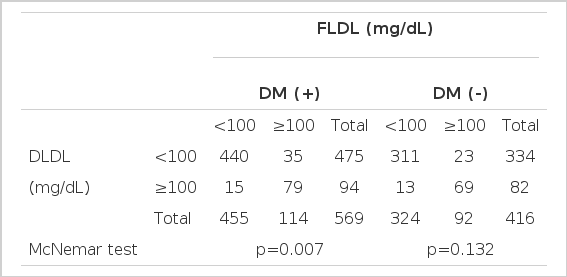
Number of subjects deemed to have achieved target low-density lipoprotein cholesterol (LDL-C) levels after statin treatment according to the method of LDL-C determination
고 찰
LDL 콜레스테롤과 심혈관 질환과의 상관관계가 잘 알려져 있으며 LDL 콜레스테롤의 수치를 낮추는 것이 심혈관 질환의 발생률을 줄인다는 연구결과들이 발표되고 있다15-19). 따라서 심혈관 질환의 위험도 평가 및 이상지질혈증의 치료효과 판정에 있어서 LDL 콜레스테롤의 정확한 측정이 매우 중요하다. LDL 콜레스테롤의 측정에는 초원심분리법, 침전법, 전기영동법, 액체크로마토그래피법, 면역침전법 및 Friedewald 공식에 의한 계산법 등 다양한 방법들이 쓰여 왔다. 참고방법인 베타 정량법은 초원심분리와 화학침전 과정이 필요하여 일상적인 검사로 사용하기에는 부적합하여 Friedewald 공식이 널리 사용되고 있다20,21). 이 공식은 혈장 내 중성지방이 대부분 초저밀도지단백 콜레스테롤의 형태로 운반되며, 콜레스테롤과 중성지방의 비가 5:1로 일정하다는 것을 전제로 한다. 그러나 혈장 내 킬로미크론이 존재하거나 중성지방이 400 mg/dL 이상에서는 신뢰할 수 없다는 것이 잘 알려져 있다21).
이상지질혈증의 1차 치료제인 statin은 atherogenic lipoprotein, 특히 LDL 콜레스테롤의 수치를 감소시키며, Friedewald 공식에 의한 계산값을 얻기 위한 변수인 총 콜레스테롤과 중성지방을 감소시키고, HDL 콜레스테롤을 증가시키는 효과가 있다14,24). ATP III에서는 statin의 효과로 LDL 콜레스테롤을 18~55% 감소시키고, 중성지방은 7~30% 감소시키며, HDL 콜레스테롤은 5~15% 증가시킨다고 보고하였다4). 본 연구에서는 총 콜레스테롤, LDL 콜레스테롤, 중성지방, HDL 콜레스테롤이 각각 -29.2±13.4%, -40.2±16.7%, -6.4±55.4%, 2.5±23.7%의 변화를 보였다(표 2).
최근의 연구들은 Friedewald 공식의 변수인 총 콜레스테롤, 중성지방, HDL 콜레스테롤 수치에 따른 제한점을 보고하고 있으며, 심지어 LDL 콜레스테롤의 농도에 따른 오차도 보고하고 있다. 몇 가지 연구들에서 Friedewald 공식과 직접 측정법을 비교하여 중성지방이 400 mg/dL 이하인 경우에도 통계학적으로 유의한 차이가 있었다고 보고하였다5-7,10,11). Jun 등이 38,243명의 한국인을 대상으로 시행한 연구에서는 중성 지방뿐만 아니라 총 콜레스테롤의 농도에 따라 Friedewald 공식에 의한 계산값과 직접측정값의 오차의 범위가 달라질 수 있다고 보고하였고12), Scharnagl 등은 LDL 콜레스테롤 수치가 낮은 경우에도 계산값이 낮게 측정된다고 보고하였다13).
많은 대규모 연구들에서 LDL 콜레스테롤을 감소시켜 심혈관 질환의 사망률과 이환률을 감소시킨다는 것이 증명되어 온 이후 고위험 환자들에게서의 statin은 필수적인 치료 중의 하나가 되어 왔다. Statin을 복용한 후에는 Friedewald 공식의 세 변수의 변화가 같이 일어나므로, 위의 연구들에 의하면 각 콜레스테롤의 변화에 따라 공식의 신뢰도가 달라질 것으로 예상된다. 그러나 statin 치료 후 이러한 우려에 대한 이제까지의 연구는 거의 찾아볼 수가 없었고, 두 측정 방법의 관계에 대한 논문들은 모두 statin 사용을 하기 전 상태에 대해서만 보고되어 왔다.
Lindsey 등이 19,343명을 대상으로 시행한 연구에서 Friedewald 공식에 의한 계산값과 균질법에 의한 직접측정값을 비교하였을 때 계산값이 측정값에 비하여 낮게 측정되었으나 강한 연관성(R2=0.94)을 보였으며8), Jeong 등이 33,792명을 대상으로 시행한 연구에서도 중성지방이 높을수록 오차는 증가하고 계산값과 측정값 사이의 연관성은 약해지는 경향을 보인다고 보고하였으나 계산값과 측정값은 강한 연관성(R2=0.973, p<0.001)을 보였다5). 본 연구는 statin 치료 후의 환자들을 대상으로 하였으며, 전반적인 연관성은 양호하였으나(R2=0.879) 이전의 연구에 비해서는 상관계수가 낮게 측정되어 연관성이 낮아짐을 알 수 있었다.
Rubies-Prat 등은 Friedewald 공식에 의한 계산법과 베타 지단백 정량검사에 의한 LDL 콜레스테롤 측정값을 비교한 연구에서 Friedewald 공식이 제2형 당뇨병 환자에서 심혈관 질환의 위험을 평가하는데 부정확하다고 보고하였으며25)Hirany 등은 당뇨병 환자를 대상으로 한 연구에서 Friedewald 공식에 의한 계산값이 면역침전법에 의한 직접 측정값 및 베타 지단백 정량검사법에 의한 측정값보다 신뢰도와 정확도가 낮다고 보고하였다26). 본 연구에서는 당뇨병군(R2=0.880)과 비당뇨병군(R2=0.876)에서의 상관관계의 차이는 보이지 않았다(그림 1).
두 측정법 사이의 연관성은 좋으나, 그 절대적인 수치에서는 DLDL-C과 FLDL-C을 대응표본 T 검정으로 비교하였을 때 당뇨군과 비당뇨군 모두에서 통계학적으로 유의한 차이가 있었다(표 3). %ΔLDL의 평균값은 전체 대상자에서 2.9±15.4%, 당뇨병군에서 2.5±15.6%, 비당뇨병군에서 3.4±15.1%이며, 분포는 그림 2와 같았다. %ΔLDL가 5% 이상 차이가 나는 경우는 전체 대상자에서 68.4%, 당뇨병군에서 69.3%, 비당뇨병군에서 67.3%로 당뇨병군과 비당뇨병군이 비슷한 분포를 보였으며 ±10% 이상 차이가 나는 경우도 각각 42.3%, 42.3%, 42.6%로 비슷한 분포를 보였다. FLDL-C의 값이 DLDL-C의 값보다 낮게 측정된 경우는 전체 대상자에서 37.4%, 당뇨병군에서 38.8%, 비당뇨병군에서 35.3%로 당뇨병군과 비당뇨병군이 별다른 차이는 없었다.
FLDL-C과 DLDL-C을 고위험군 환자의 LDL 콜레스테롤의 치료 목표인 100 mg/dL을 기준으로 나누어 비교하였을 때, 비당뇨병군에서는 통계학적으로 유의한 차이가 없었지만(p=0.132) 당뇨병군에서는 통계학적으로 유의한 차이가 있었다(p=0.007). 당뇨병군에서는 statin 치료 후에도 DLDL-C이 100 mg/dL 이상인 실제로 치료목표에 도달하지 못한 94명의 환자들 중 17.9%인 15명이 FLDL-C은 100 mg/dL 이하로 치료 목표에 도달한 것으로 나타났다(표 4). 이러한 결과는 statin 복용 후 치료효과 판정을 목적으로 Friedewald 공식을 이용한 계산값을 이용하였을 때 당뇨환자 중 17.9%의 환자들은 치료를 변경해야 하거나 용량 조절을 해야 함에도 불구하고 적절한 치료를 받지 못할 가능성이 있음을 시사한다. 반면에 35명은 FLDL-C이 100 mg/dL 이상으로 치료목표에 도달한 것으로 계산되어 과잉치료를 받을 수 있는 것으로 나타났다. Statin 치료 후에 DLDL-C이 100 mg/dL 이하인 475명의 환자들 중 92.6%인 440명은 FLDL-C 역시 100 mg/dL 이하로 높은 일치율을 보였다. 이러한 치료효과 판정에 있어서의 당뇨병군과 비당뇨병군 간의 차이는 statin 치료 후에 대한 연구 결과를 거의 찾을 수 없고, 그 기전에 대한 연구가 드물기 때문에 그 이유에 대한 설명은 명확하지 않다. 다만 추정컨대, 제 2형 당뇨병에서는 중성지방의 대사이상이 흔한 것으로 알려져 있고29,30), statin 치료 효과에 있어서 LDL 콜레스테롤의 감소율이 중성지방의 감소율에 비해 다소 높기 때문에 치료 후에도 중성지방 수치가 높은 경우가 많을 것으로 생각되어 계산식에 의한 값의 차이가 클 것으로 생각된다4).
본 연구의 제한점은 첫째, 후향적 연구이므로 고혈압, 갑상선 질환, 심부전 등의 동반질환에 의한 영향과 식이나 운동, 비만, 흡연, 알코올 등의 생활습관의 차이로 인한 영향을 배제하기 어렵다. 둘째, 본원을 내원한 환자들만을 대상으로 하여 분석이 시행되었으므로 이러한 결과가 모든 환자를 대표할 수는 없을 것이다. 셋째, statin 복용 기간을 통제하지 못하였고, 각 환자들의 콜레스테롤 수치를 연속적으로 측정하지 못하여 statin 복용기간에 따른 차이를 알기 어렵다. 그러나 6개월 이상 복용한 환자를 대상으로 하였기 때문에 statin의 효과에 의한 차이를 비교하기에는 부족하지 않았을 것으로 생각된다.
결론적으로, Statin 치료 후 Friedewald 공식으로 계산한 LDL 콜레스테롤과 직접 측정한 LDL 콜레스테롤 수치는 비교적 좋은 연관성을 보였으나, 각각의 수치의 비교에서는 의미 있는 차이를 보였다. 특히 당뇨병군의 치료효과 판정에서는 유의한 차이가 있었다. 향후 statin 치료의 적정성을 평가하거나 치료 변경 여부를 결정하는 경우에 Friedewald 공식에 의한 계산값과 LDL 콜레스테롤의 직접측정법의 비교에 대해서 추가적인 연구가 뒷받침되어야 할 것으로 생각된다.